Introducing the HCCI Home Care Data Series
As the representative body for home care providers, Home & Community Care Ireland (HCCI) is launching a new series of quarterly reports to make data from the home care sector more accessible for service users, families, policymakers, researchers and the media. Each quarter, HCCI will release the latest key data from the home care sector. Over time, HCCI will build a comprehensive databank containing data on a range of home care metrics, allowing people to understand the state of the home care sector, study trends and understand where the home care sector is succeeding and where it is struggling.
This Issue: Home Care Waiting Lists – 2021 to 2022
This issue focuses on HSE Home Support waiting lists, featuring changes between the beginning of 2021 and the end of 2022, waiting list data for each month in each Community Healthcare Organisation (CHO) & Local Health Office (LHO) and a series of graphs and tables that visualise the data.
Key points:
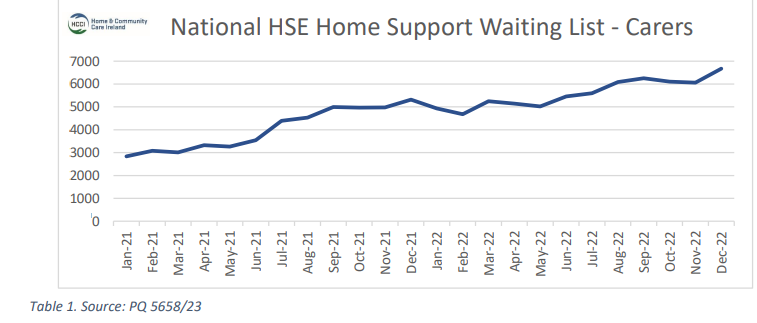
- The waiting list for people in need of a carer is 6,673 as of December 2022, a 25% increase since the end of December 2021.
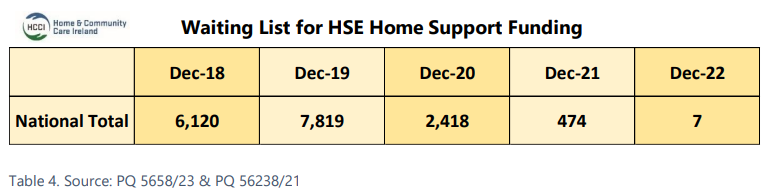
- The waiting list for funding for home care has effectively been eliminated, with 7 people waiting at the end of December 2022, compared to 474 in December 2021 and 2,144 in January 2021.
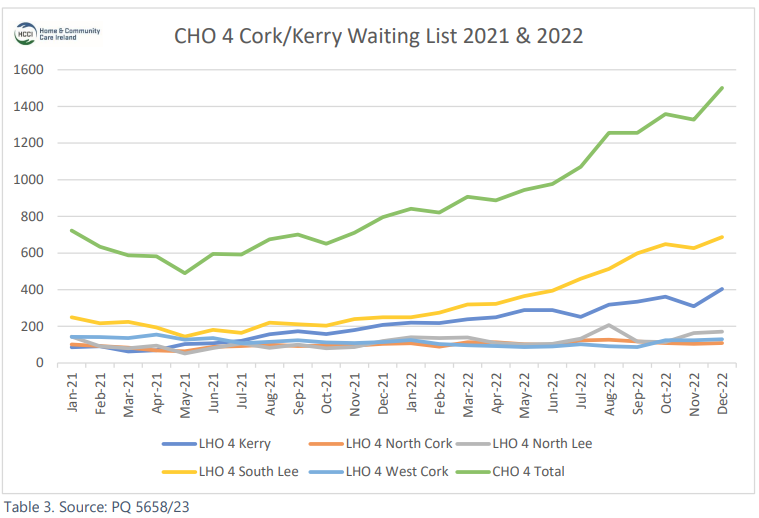
- CHO 4 (Cork/Kerry) now has the highest waiting list of people in need of a home carer in Ireland at 1,501.
- CHO 9 (North Dublin) continues to have the lowest waiting list at 127.
Comparing 2022 to 2021
Between December 2021 and December 2022, the number of people waiting for a home care worker increased by 1,351 or 25%. This serves as evidence that demand for home care remains strong. The recruitment crisis for both private home care providers and the HSE continues unabated. Table 1 shows the clear trend toward increasing waiting lists figures. This should serve as a warning as to what will happen to waiting lists in 2023 if measures to address capacity within the sector are not implemented.
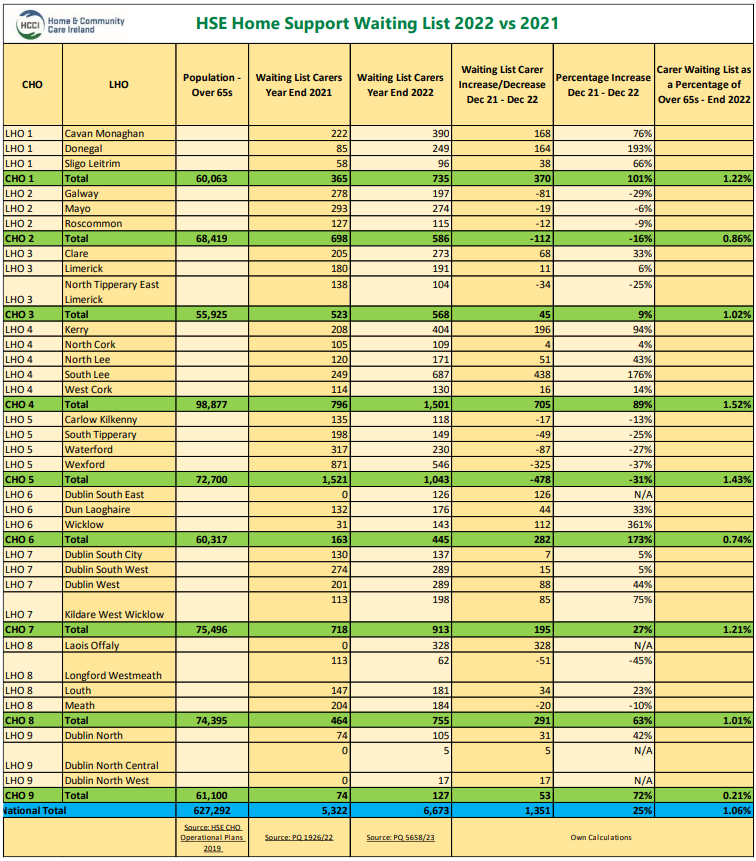
Only two CHOs, 2 (-16%) & 5 (-31%) saw a reduction in waiting list numbers. CHO 5’s 31% reduction comes from a high base (1,521 in 2021 vs 1,043 in 2022). Waiting lists are measured as a percentage of over 65 year olds within each CHO to add context to waiting list data. On a national level 1.06% of over 65s are waiting for home care. For CHO 5 (South East), 1.43% of over 65s are waiting for care, the second highest after CHO 4 (Kerry, Cork – more on this CHO below).
Likewise, CHO 7 (South Dublin/Wicklow) had the highest increase of 173%. Putting that into context – the high increase comes from a low base in 2021. This meaning that 0.74% of older people there are waiting for home care which is below the national average.
CHO 9 (North Dublin) is comfortably the best performer. With 127 people, or 0.21% of over 65s on the waiting list at the end of December 2022.
CHO 4 (Cork/Kerry) have the highest waiting list, with 1,501 people waiting, accounting for 22% of the national waiting list. Table 3 breaks down the waiting list figures in each LHO across 2021 and 2022, showing a steep rise in the South Lee and Kerry LHOs beginning around Summer 2022.
Waiting List for Home Support Funding
Data from table 4 shows that there is effectively no waiting list for home care funding anymore. Prior to 2020, the waiting list for funding was significantly higher than the waiting list for a carer. This changed after the onset of Covid-19 when the Government delivered additional funding for home care, which continued into Budget’s 21, 22 & 23. Waiting lists are now no longer because of a lack of funding. But rather a lack of supply of home care workers.
How Long are People Waiting for Home Care?
In short, we don’t know. The HSE do not collect this data nationally. When asked about the rationale for this in a PQ by Colm Burke, TD, the HSE said:
“At present, activity data in relation to the average length of waiting time is
not collated nationally. While this information may be available locally, it
would take considerable resources to collate this nationally. By their very
nature, Home Support waiting lists reflect a point in time. Given the finite
resources available within Home Support services, waiting list management
processes must take into account the HSEs prioritisation procedures, wherein
those whose clinically assessed needs are greater than others, are prioritised
for service. In light of these parameters, providing an average time frame a
person remains on the waiting list would ultimately provide an inaccurate
view of the Home Support waiting list in its totality.” (PQ 5660/23).
Conclusion
Waiting Lists in brief (As of end of December 2022):
- Waiting list (carer): 6,673
- Waiting list (funding): 7
- Waiting list (carer) increase since Dec 21: + 1,351 (+25%)
- Waiting list (funding) decrease since Dec 21: – 467 (-99%)
- Highest waiting list: CHO 4 (Cork/Kerry) 1,501
- Lowest waiting list: CHO 9 (North Dublin) 127
- Biggest increase since Dec 21: CHO 4 (Cork/Kerry) +705
- Biggest decrease since Dec 21: CHO 5 (South East) – 478
The HCCI Data Series aims to make home care sector data accessible. To inform readers about trends, successes and problem areas. This issue focused on waiting lists, showing a clear trend toward high waiting lists in nearly every area of the country. It illustrates the impact that the recruitment and workforce capacity problems are having on the home sector at a critical time. As the Government enters the implementation phase of the Cross-Department Strategic Workforce Advisory Group. The trends highlighted here should reinforce the importance of releasing capacity into the sector.
HCCI will build on the data outlined here to continually monitor waiting list trends and introduce new data to inform those interested in the state of the home care sector in Ireland.
Below is a graph that compares waiting lists in every CHO and a table showing the waiting list for a home care worker in each CHO and LHO across 2021 and 2022.